Kmeans Clustering of Movie Franchises Reveals Surprising Results
Executive Summary
These reports provide a clear, data-driven look at film franchises. Using totals from The Numbers (worldwide plus inflation-adjusted domestic), we summarize how many movies franchises make, how long they last, when they start, how earnings are distributed, and group them into 3 main categories.
K-Means Clustering of Movie Franchises (Domestic vs. Worldwide Box Office)
What you’re looking at:
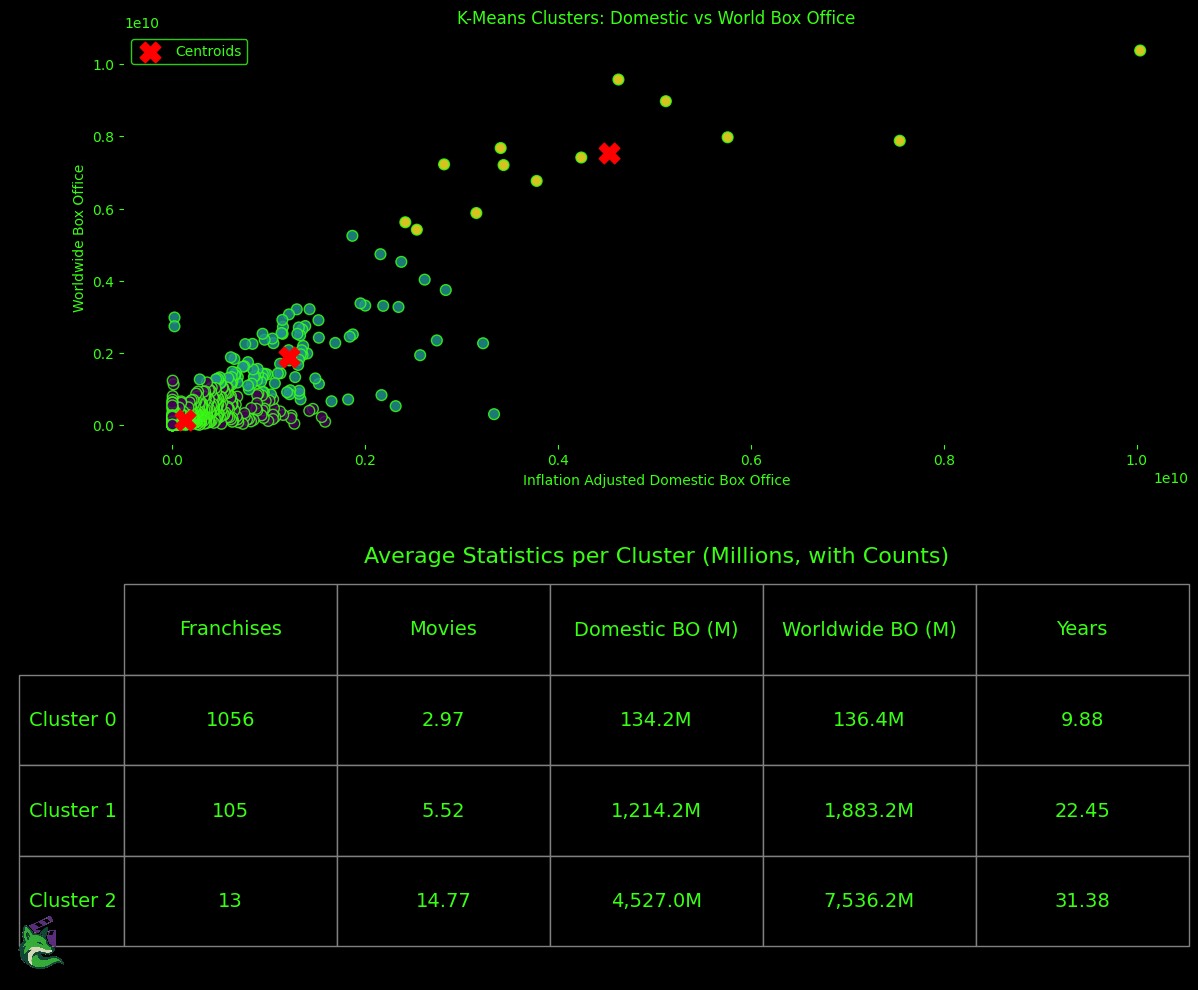
Each dot is a franchise, plotted by its inflation-adjusted domestic box office (x) and worldwide box office (y). We used k-means to group similar franchises into three clusters; the red X’s are the centroids (the “average” point of each group). We only plotted domestic vs worldwide earnings as 4D cluters(4 variables used) would not be possible to visualize.
Preprocessing notes
- The Marvel Cinematic Universe was removed because it is an extreme outlier that would always form a one-item cluster by itself.
- Franchises with missing or zero domestic earnings were excluded.
A 10-second explainer: What is k-means?
K-means finds k groups of points that are close together. It guesses k centers, assigns every point to the nearest center, moves the centers to the middle of their assigned points, and repeats until things stop changing. The result is clusters of similar franchises based on the three inputs here: domestic and worldwide box office, age and number of movies.
Cluster results (simple English)
Counts and averages below are taken from the table in the graphic. “BO” = box office totals per franchise.
Cluster 0 — “Short-run & modest earners”
(~1,056 franchises — ~90% of the sample)
- Avg movies: ~3
- Avg domestic BO: $134M
- Avg worldwide BO: $136M
- Avg lifespan: ~10 years
- Read: Most franchises are small, short, and bring in a few hundred million total. Domestic and worldwide totals are similar, implying limited global breakout.
Cluster 1 — “Established mainstream franchises”
(~105 franchises — ~9% of the sample)
- Avg movies: ~5.5
- Avg domestic BO: $1.21B
- Avg worldwide BO: $1.88B
- Avg lifespan: ~22 years
- Read: These are reliable box-office brands with multiple entries over decades. Worldwide ≈ 1.55× domestic, showing growing dependence on international markets.
Cluster 2 — “Legacy mega-franchises”
(~13 franchises — ~1% of the sample)
- Avg movies: ~14.8
- Avg domestic BO: $4.53B
- Avg worldwide BO: $7.54B
- Avg lifespan: ~31 years
- Read: A tiny elite of long-running series with very large global audiences. Worldwide ≈ 1.66× domestic, emphasizing outsized international appeal.
What this says about the market
- The landscape is highly skewed: ~1% of franchises sit in a mega-tier, ~9% are solid mainstream performers, and ~90% are modest in scope and earnings.
- As franchises get larger and older (Clusters 1 → 2), the international share of revenue grows.
- Removing the MCU lets us see that even without the biggest modern outlier, there’s still a clear three-tier structure.
How to use this
- Benchmarking: New or mid-stage series can be compared to these clusters to set realistic revenue ranges and lifespan expectations.
- Greenlighting & marketing: Moving from Cluster 0 to 1 typically requires brand building and international expansion; Cluster 2 success is rare and depends on durable IP.
- Caveat: K-means groups by box office, age, and number of movies, only; quality, budgets, genre, and release strategy are not in the model. Clusters are descriptive of the current franchise industry.
Conclusion
Excluding the MCU and franchises with missing/zero domestic data, k-means reveals three tiers: a large majority of short, modest earners (~90%), a smaller set of established mainstream series (~9%), and a tiny elite of long-running mega-franchises (~1%). As franchises move up these tiers, film counts, lifespans, and box office rise sharply, with international revenue making up a growing share.