How Uneven Are Box Office Earnings Across Movie Franchises?
Executive Summary
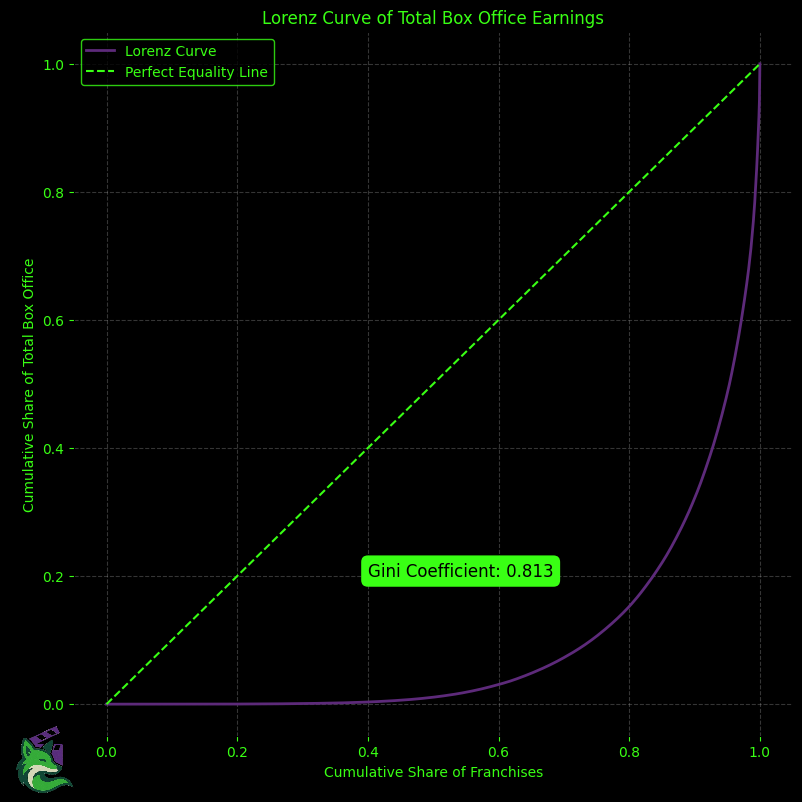
This report examines how uneven box office earnings are across movie franchises using a Lorenz curve and a Gini coefficient. Based on total box office (worldwide plus inflation-adjusted domestic as defined by the source), the Gini is 0.813, indicating extreme concentration: a small set of franchises captures most revenue. The chart shows how quickly earnings pile up among top franchises compared with the rest.
How Uneven Are Box Office Earnings Across Franchises?
Lorenz Curve and Gini Coefficient Analysis
This chart plots the Lorenz curve for total box office earnings by movie franchise and reports a Gini coefficient of 0.813.
What’s being measured?
Total box office for each franchise = worldwide box office + inflation-adjusted domestic box office (as defined by the data source). We then sort franchises from lowest to highest earner and plot their cumulative shares.
How to Read the Plot (Plain English)
- The x-axis shows the cumulative share of franchises (from the smallest earners on the left to the biggest on the right).
- The y-axis shows the cumulative share of total box office those franchises account for.
- The dashed diagonal is perfect equality: if every franchise earned the same money, the curve would sit on this line.
- The purple Lorenz curve bows below the diagonal. The farther it bows, the more concentrated the money is among a small group.
What the Numbers Say
- Gini coefficient: 0.813.
- The Gini ranges from 0 (perfectly equal) to 1 (maximally unequal).
- 0.813 signals extreme concentration: a small fraction of franchises takes most of the money.
- A concrete read from the curve: about 85% of franchises earn only ~20% of total box office, meaning the top ~15% of franchises capture ~80%.
- The curve’s steep rise near the right edge shows that a handful of top franchises (think mega-brands and shared universes) account for a disproportionate share of global revenue.
Why Earnings Are So Concentrated
- Global brand power: Well-known IP travels worldwide, lifting top entries far above the rest.
- Sequel momentum: Successful first films create audiences that compound across sequels and spin-offs.
- Release scale & marketing: Wide releases, premium formats, and large ad budgets concentrate results at the top.
- International markets: Growth territories can add huge upside to already strong performers.
Data note: “Domestic” follows the the-numbers.com franchise pages and may not map exactly to U.S./Canada for every title. If “worldwide” already includes “domestic,” this total is a composite indicator rather than a standard industry “worldwide” figure; however, the inequality pattern shown by the Lorenz curve remains valid.
Conclusion
Box office earnings are highly unequal across franchises. Most contribute relatively little, while a small elite captures the majority of revenue. As a result, average outcomes are misleading for comparisons or investment decisions the market is arguably driven by outliers.